THE ISAAC NEWTON TELESCOPE GALACTIC PLANE SURVEYS
The Isaac Newton Telescope Galactic Plane Survey (IGAPS) is the merger of two photometric surveys in the optical wavelenght range, IPHAS and UVEX, both based on data obtained in ~1860 square degrees covering the northern Galatic plane using the Wide Field Camera (WFC) from 2003 to 2018. The IGAPS point-source catalogue contains 295 million objects, and it provides measures of 174 parameters.
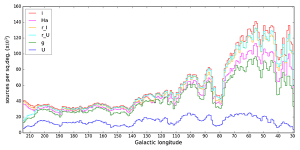
Number of sources as a function of Galactic longitude in each of the six pass bands, with Sloan i < 20.5 magnitudes.
The catalogue, together with the complete reduced-image repository (now accessible via igapsimages.org), is the culmination of several hundred nights of observing conducted over a 15-year period by around 70 students (many gaining their first observing experience) and established astronomers. This was a grass roots effort made possible by a long succession of normally awarded time allocations.
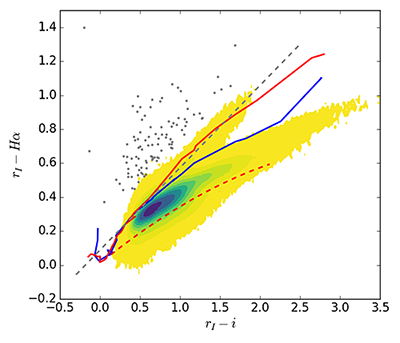
Colour-colour diagram rI – Hα vs. rI – Sloan i for Galactic longitude between 60 and 65°. Density of catalogued sources is portrayed by the squared root contoured colours. Only sources with rI < 19 mag have been plotted. The solid line in red is the unreddened main sequence, while the dashedline is the reddening line for an A2V star up to AV=10. The blueline is the sequence for the giants. The grey dashed line is the emitters selection cut while the grey dots are the selected emitters at > 5σ.
All IGAPS data were processed by the Cambridge Astronomical Survey Unit, at the Institute of Astronomy in Cambridge. The uniformly-calibrated bandmerged IGAPS catalogue was assembled using the high performance computing cluster in the Centre for Astrophysics Research, University of Hertfordshire.
This first federation of UVEX blue photometry with red IPHAS data provides, in the IGAPS catalogue, a resource of great utility for the examination of the stellar content of the northern Milky Way. Previous applications of the separate survey databases have ranged all the way from local white dwarfs up to the most luminous and massive stars detected at heliocentric distances of up to 10 kiloparsecs. The merger, especially now that increasingly precise astrometry is flowing from the Gaia mission as well, can become a convenient basis for more flexible and incisive analysis of early, late and high-mass stellar evolution.
The Galactic coordinate footprint boundaries are -5° latitude < 5° and 30° < longitude < 215°. A total of 264 million objects come from the IPHAS survey, while 246 million are objects from the UVEX survey. In total data from both surveys is available for 215 million objects.
Photometry is provided for each of the IPHAS filters, Sloan i, Sloan r, and Hα, and UVEX filters, Sloan r, Sloan g, and URGO. A uniform calibration, referred to the Pan-STARRS system, is applied to the Sloan g, Sloan r, and Sloan i bands, while the Hα calibration is linked to Sloan r and then is further improved via field overlaps. As exposures in the Sloan r band were obtained in both the IPHAS and UVEX surveys, typically a few years apart, the catalogue includes two distinct measures, rI and rU.
Down to i ~20 mag, most stars are also detected in Sloan g, Sloan r, and Hα. The limiting magnitude is approximately 21 in the Sloan r band (median 5σ detection over the noise), with median seeing of 1.1 arcsec, and detector saturation starting around 12-13 magnitudes Photometry is provided in both the Vega and AB systems.
The astrometry in all five bands has been recalculated in the reference frame of Gaia Data Release 2, with median differences with Gaia of ~0.04 arcsec for all filters except URGO, in which ~0.07 arcsec is obtained.
A careful quality control has been developed for each WFC field, taking into account factors such as the seeing, limiting magnitude, point-source ellipticity, and the quality of photometric comparison with Pan-STARRS. Due to overlaps and field repetition, each source has been observed usually more than once. The best quality measurement is reported in the published catalogue, together with the photometry for the second best measurement when available. When those two are compared, the reproducibility error is below 0.02 mag in the range of magnitudes 13 < Sloan r < 19.
The data from the different photometric bands can be used for making colour-colour diagrams. Among other applications, these diagrams are useful for target selection in future spectroscopic surveys such as WEAVE at the William Herschel Telescope (WHT). Stars brighter than r = 19.5 mag are tested for narrow-band Hα excess signalling line emission, finding 8292 candidate emission line stars.
Source: Isaac Newton Group of Telescopes
- 498 reads
Human Rights
Fostering a More Humane World: The 28th Eurasian Economic Summi

Conscience, Hope, and Action: Keys to Global Peace and Sustainability


Ringing FOWPAL’s Peace Bell for the World:Nobel Peace Prize Laureates’ Visions and Actions

Protecting the World’s Cultural Diversity for a Sustainable Future


Puppet Show I International Friendship Day 2020