Looking at the Insides of Stars
We can only really see what’s going on at the surface of a star. However, the motions within stellar interiors show themselves as subtle variations in the star’s brightness, and with the dense observations of planet-finding missions, we can pick up these variations at very fine levels.

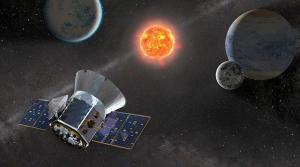
Artist’s impression of TESS observing planets orbiting a dwarf star.
Brightness Changes
Several things can be responsible for a star’s changes in brightness, such as planets or companion stars, but stars can also brighten and dim intrinsically. The outer layers of a star can oscillate as the star cools and heats up, while convective processes can cause different oscillations in the body and at the surface of a star. By studying these oscillations — in a process called asteroseismology — we can learn more about stellar properties and internal structures.

Asteroseismology uses different oscillation modes of a star to probe its internal structure and properties.
Asteroseismology studies require stellar observations taken regularly over a long time. Luckily for astronomers, those are the same sort of observations required for the transit planet-finding method! Over the last decade, missions like Kepler and CoRoT have provided data that’s been used both to find planets and to characterize the insides of stars.

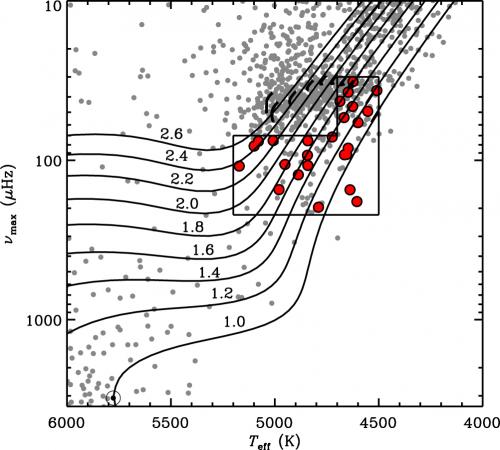
A Hertzspring-Russell (HR) diagram showing stars’ maximum oscillation frequency (instead of brightness) versus their temperature. The gray dots are all Hipparcos stars brighter than sixth magnitude, while the red dots are the red giant stars used in this study. The Sun is shown at the lower-left corner of the diagram. The tracks show evolutionary models for stars with the masses indicated (in solar-masses).
The Transiting Exoplanet Survey Satellite (TESS) is carrying out an all-sky survey searching for planets. It covers the sky in sectors, taking images of its entire field of view every thirty minutes. The thirty-minute cadence is well-suited to characterize red giant stars’ oscillations, and TESS is expected to turn up roughly 500,000 red giant stars whose oscillations can be studied.

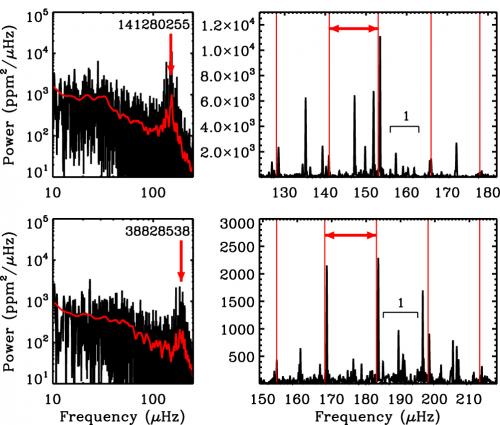
Representative power spectra obtained from the red giant light curves. The left panels have the spectra in log–log space, with the maximum frequency distinguished by the vertical arrow. The right panels show a close-up of the power spectra showing frequencies associated with particular oscillations. The separation between those dominant frequencies is shown using the red vertical lines with the horizontal arrow showing the average separation.
So it makes sense to set up a framework to analyse TESS data in the context of stellar oscillations. Motivated by this, a group of scientists led by Víctor Silva Aguirre (Aarhus University, Denmark) carried out the first analysis of red giant star oscillations using TESS data.
TESS-ting for Frequencies
Aguirre and collaborators considered stars observed in TESS sectors 1 and 2 (not necessarily both) for their sample. They then used the Hipparcos astrometry mission catalog to identify red giant stars whose oscillations could be seen in TESS data. The maximum frequency of oscillations is set by a star’s temperature, mass, and brightness.
Assuming a mass of 1.2 solar masses for red giant stars (a reasonable assumption), the maximum frequency could be expected to fall between 30 and 220 µHz. From the available stars, the authors selected the twenty-five brightest stars for their oscillation analysis.
We’ve Got the Power (Frequency Spectrum)!
From the light curves of each star, Aguirre and collaborators created power frequency spectra, which show the power in the various frequencies that make up a signal. For stars, such power spectra can be used to identify oscillations that could be associated with internal processes.
By combining the oscillation frequency information with astrometry data from the Gaia mission, Aguirre and collaborators showed that they could measure the properties of these red giants to high precision levels — stellar radii can be determined to a precision of a few percent, masses to 5%–10%, and ages to around 20%.
With the incoming flood of TESS and Gaia data, we will almost certainly be able to characterize red giant stars better than we have in the past. And this is to say nothing of what will come out of TESS’s extended mission, beginning July 2020!
Source: American Astronomical Society
- 233 reads
Human Rights
Ringing FOWPAL’s Peace Bell for the World:Nobel Peace Prize Laureates’ Visions and Actions

Protecting the World’s Cultural Diversity for a Sustainable Future

The Peace Bell Resonates at the 27th Eurasian Economic Summit

Declaration of World Day of the Power of Hope Endorsed by People in 158 Nations

Puppet Show I International Friendship Day 2020

