NASA Goddard Creates CGI Moon Kit as a Form of Visual Storytelling
A new NASA out-of-this-world animation allows humanity to experience their closest galactic neighbor as never before through an online “CGI Moon kit.”

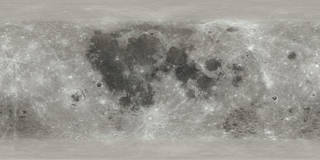
This color map, available as 24-bit RGB TIFFs of various sizes, is centered on 0° longitude.
Smartphones have allowed millions to become amateur photographers, but capturing the perfect picture can still be difficult under certain conditions. So, imagine trying to capture an image of a 3D object while simultaneously moving at almost a mile per second. The light source over 93 million miles away and the entire surface must also be accurately mapped topographically down to a level of 100 feet.

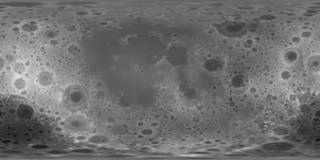
The displacement map, at 64, 16, and 4 pixels per degree, centered on 0° longitude. Available as either floating-point TIFFs in kilometers, relative to a radius of 1737.4 km, or 16-bit TIFFs in half-meters, relative to a radius of 1,747,400 meters.
These are the challenging conditions NASA’s Lunar Reconnaissance Orbiter (LRO) has overcome for the 10 years – and counting – orbiting Earth’s Moon.
Using data and imagery from LRO, Ernie Wright brings the Moon to life in unprecedented detail. Wright is a science visualizer who works at the Scientific Visualization Studio at NASA’s Goddard Space Flight Center in Greenbelt, Maryland. He created the online CGI Moon kit.
The purpose of the CGI Moon kit is to make NASA’s data more accessible to 3-D artists. Wright initially created the 3D Moon map as a Scientific Visualization Studio (SVS) resource, but after receiving multiple requests for the data used to create his Moon visualizations, he decided to share his creation as a way for artists to connect with the LRO mission.
“[The Moon kit] will bring the LRO data within reach of lots of other artists who want to do the kinds of things that I do,” Wright said.
One of the primary goals for the LRO is to accurately map the topography of the Moon to prepare for safer landing to sights of interest for the Artemis program. Two gadgets on this spacecraft have been key components: The Lunar Reconnaissance Orbiter Camera (LROC) and the Lunar Orbiter Laser Altimeter (LOLA).
LROC works like a scanner, building an image line-by-line, using the motion of the spacecraft over the lunar surface to build an image. LOLA uses laser pulses to detect the dimensions of the Moon. A single laser pulse is sent down and divided into five separate beams. The pulses reach the Moon’s surface and bounces back to the spacecraft. LOLA then measures the nanoseconds it takes for the beam to return as a means of reading the Moon’s topography. If a beam comes back quickly, LOLA can tell that the landscape has a high elevation. If the beam comes back weaker, the surface is rough and power from the beam was scattered.
After collecting a set amount of data, the spacecraft sends the bits and bytes of information to receivers on Earth, and the LRO team is tasked with processing and interpreting the raw data.
LRO scientist Noah Petro at NASA Goddard understands the value of Wright’s work, and the social implications it holds for connecting the LRO mission with the general public. Petro acknowledges the stunning visuals as a key component for the LRO Mission’s success. “He can help tell the story using the LRO data, and illustrate difficult-to-communicate ideas or concepts, of whatever the story might be,” Petro said, “so I think he’s already had some influence on how people consume the information, when they don’t even know it.”
Wright explains creating and sharing the Moon is the easy part. The real challenge is in setting the scene. In order to successfully tell a story to the audience, Wright takes lighting, location, and the overall big picture into strong consideration.
“Using 3D animation software is a lot like filming live action, with lights, cameras, props and sets” Wright said, “but visualization is more like filming a documentary. You’re being factual, but you’re also creating a narrative.”
When he created a video showing the Apollo 17 landing site, Wright took an apnproach that would focus on highlighting the path of the astronauts. The sight on the Moo is smaller than a pixel, and zooming into the sight and showing the rover tracks all fuel the ultimate goal of telling the story of the images captured by LRO.
“We’re putting the pictures back into context, Wright said, “we’re putting them back where they came from.”
The extensive amount of data is readily available online, but without an extensive background in the LRO’s technology, the information can be difficult to interpret. Visual animations make this public data digestible for those without a technical science background. “All of this data is publicly available but not as accessible as it could be,” Wright said, “so, in releasing this in a form that a lot of people can appreciate and use.” Because of this, the importance of connecting this science with art and imagery is crucial for the mission to achieve its full potential.
And as NASA prepares for Artemis, Wright’s animations assist in planning for safer, more successful missions. There is now enough data where Wright can use his computer program to make animations depicting what specific areas on the Moon will look like in 2024. This allows scientists to find further target zones for upcoming exploration.
By making the most data ever collected by a planetary spacecraft accessible to a general audience, Wright’s work can be found in a wide range of places, from textbooks, to online templates, to backdrops at events.
“He can tell the story that helps us communicate what we do much better than I think just us alone,” Petro said.
Source: US National Aeronautics and Space Administration
- 306 reads
Human Rights
Ringing FOWPAL’s Peace Bell for the World:Nobel Peace Prize Laureates’ Visions and Actions

Protecting the World’s Cultural Diversity for a Sustainable Future

The Peace Bell Resonates at the 27th Eurasian Economic Summit

Declaration of World Day of the Power of Hope Endorsed by People in 158 Nations

Puppet Show I International Friendship Day 2020

