An Inside Look at Hurricane Dorian from a Mini Satellite
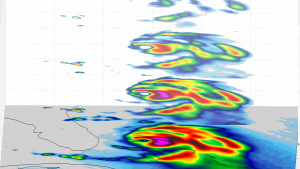
A new view of Hurricane Dorian shows the layers of the storm, as seen by an experimental NASA weather satellite that's the size of a cereal box. TEMPEST-D reveals rain bands in four layers of the storm as Hurricane Dorian approaches Florida on Sept. 3, 2019. The multiple vertical layers show where the strongest convective "storms" within the hurricane are pushing high into the atmosphere, with pink, red and yellow corresponding to the areas of heaviest rainfall.

Hurricane Dorian off the coast of Florida, as seen by the small satellite TEMPEST-D at 2 a.m. EDT on Sep. 3, 2019 (11 p.m PDT on Sept. 2, 2019). The layers in the animation reveal slices of the hurricane from four depths, taken at different radio wavelengths. The vertical view of Dorian highlights where the storm is strongest in the atmosphere. The colors in the animation show the heavy rainfall and moisture inside the storm. The least-intense areas of rainfall are shown in green, while the most intense are yellow, red and pink.
Known as a CubeSat, TEMPEST-D (Temporal Experiment for Storms and Tropical Systems Demonstration) uses a miniaturized version of a microwave radiometer - a radio wave instrument used to measure rain and moisture within the clouds. If TEMPEST-D can successfully track storms like Dorian, the technology demonstration could lead to a train of small satellites that work together to track storms around the world. CubeSats are much less expensive to produce than traditional satellites; in multiples they could improve our global storm coverage and forecasting data.
Source: Jet Propulsion Laboratory
- 223 reads
Human Rights
Ringing FOWPAL’s Peace Bell for the World:Nobel Peace Prize Laureates’ Visions and Actions

Protecting the World’s Cultural Diversity for a Sustainable Future

The Peace Bell Resonates at the 27th Eurasian Economic Summit

Declaration of World Day of the Power of Hope Endorsed by People in 158 Nations

Puppet Show I International Friendship Day 2020

