Science
Cassini Gets New Views of Titan's Land of Lakes

This false-color mosaic, made from infrared data collected by NASA's Cassini spacecraft, reveals the differences in the composition of surface materials around hydrocarbon lakes at Titan, Saturn's largest moon.
- Read more
- 386 reads

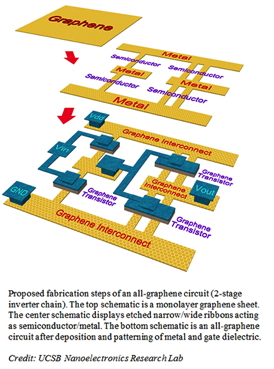
Researchers Advance Scheme to Design Seamless Integrated Circuits Etched on Graphene: UC Santa Barbara researchers demonstrate seamless designing of an atomically-thin circuit with transistors and interconnects etched on a monolayer of graphene
- Read more
- 408 reads
Stealth nanoparticles lower drug-resistant tumors' defenses
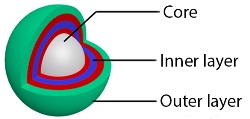
A layered nanoparticle with an anticancer drug core, a gene-silencing inner layer and a tumor-targeting outer layer could provide a new way to attack drug-resistant cancer cells.
- Read more
- 357 reads
ALMA Probes Mysteries of Jets from Giant Black Holes

Two international teams of astronomers have used the power of the Atacama Large Millimeter/submillimeter Array (ALMA) to focus on jets from the huge black holes at the centres of galaxies and observe how they affect their surroundings. They have respectively obtained the best view yet of the molecular gas around a nearby, quiet black hole and caught an unexpected glimpse of the base of a powerful jet close to a distant black hole.
- Read more
- 379 reads
Rings, Dark Side of Saturn Glow in New Cassini Image

This colorized mosaic from NASA's Cassini mission shows an infrared view of the Saturn system, backlit by the sun, from July 19, 2013.
- Read more
- 377 reads
A chameleon in the physics lab: Looking cooler when heated, a thin coating tricks infrared cameras
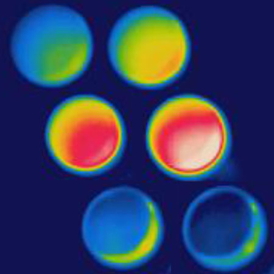
A new coating intrinsically conceals its own temperature to thermal cameras.
- Read more
- 385 reads
Project aims to mass-produce 'nanopetals' for sensors, batteries

These color-enhanced scanning electron microscope images show nanosheets resembling tiny rose petals. The nanosheets are key components of a new type of biosensor that can detect minute concentrations of glucose in saliva, tears and urine. The technology might eventually help to eliminate or reduce the frequency of using pinpricks for diabetes testing.
- Read more
- 457 reads
Asteroid 2013 TV135 - A Reality Check

This diagram shows the orbit of asteroid 2013 TV135 (in blue), which has just a one-in-63,000 chance of impacting Earth. Its risk to Earth will likely be further downgraded as scientists continue their investigations.
- Read more
- 442 reads
Long-Sought Pattern of Ancient Light Detected

This artist's impression shows how photons from the early universe are deflected by the gravitational lensing effect of massive cosmic structures as they travel across the universe.
- Read more
- 421 reads
Human Rights
Fostering a More Humane World: The 28th Eurasian Economic Summi

Conscience, Hope, and Action: Keys to Global Peace and Sustainability


Ringing FOWPAL’s Peace Bell for the World:Nobel Peace Prize Laureates’ Visions and Actions

Protecting the World’s Cultural Diversity for a Sustainable Future


Puppet Show I International Friendship Day 2020